


Written by Luke Gibson
Numbers rule our world. They’re prevalent in all areas of society, from speed limits and car prices to the numbers we set on our alarm clocks and, unfortunately, the number of carbohydrates in a block of chocolate.
At the end of Year 12, I didn’t get a good result. I possibly blocked out the final number for my matriculation in 1989, but I know it was in the 40s. Yet here we are, over three and a half decades later, and I’m attending university, where numbers really matter.

But do they matter more depending on who you are? I have a friend who is studying a Bachelor of Arts, majoring in Philosophy. He is retired and has no intention to do anything with it. He says he’s doing it “for fun”!
So numbers for him don’t matter a great deal. Yet here I am, doing a Bachelor of Social Science (Psychology) with the ultimate goal of becoming a sports psychologist, and numbers matter a whole lot to me.
Academic Progress:
The numbers start as soon as I log into the Charles Sturt student portal. The pie chart seems so conclusive, yet I have to remind myself how to interpret this statistic.
It shows the progress you have made through your course.
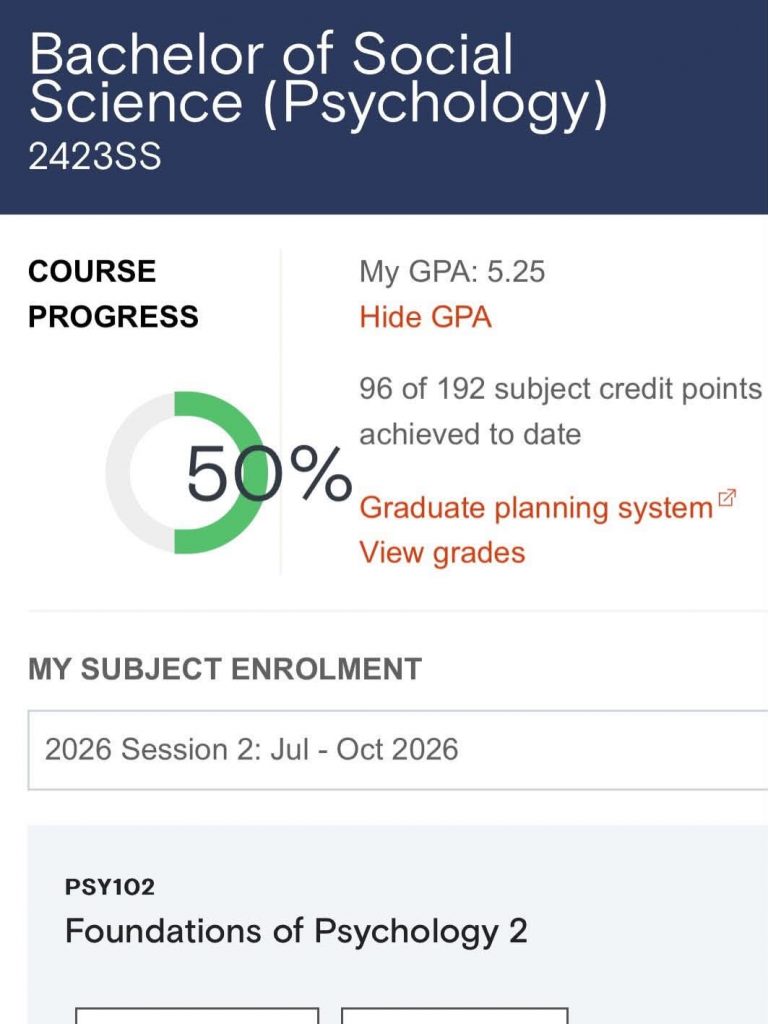
It says that I’m 50% of the way through my degree and technically it’s right. I’ve completed twelve of the twenty-four units required to finish this degree. Yet I achieved eight of those units with RPL (Recognition of Prior Learning) from the Diploma in Counselling I finished in 2024 through TAFE.
This means I’ve only completed four units at Charles Sturt. But I’ll take the win and accept I’m 50% of the way through this degree if I count the required work being spread over two tertiary institutions.
Seeing that I’m 50% of the way through my degree is gratifying, but even so, when I complete the Foundations of Psychology 2 subject this semester, I still have eleven subjects to go. In my own unique way, I will celebrate when I have only single-digit numbers of subjects left to complete.
You can read more information about Academic Progress here: https://www.csu.edu.au/current-students/studying/support/academic-progress
Grades:
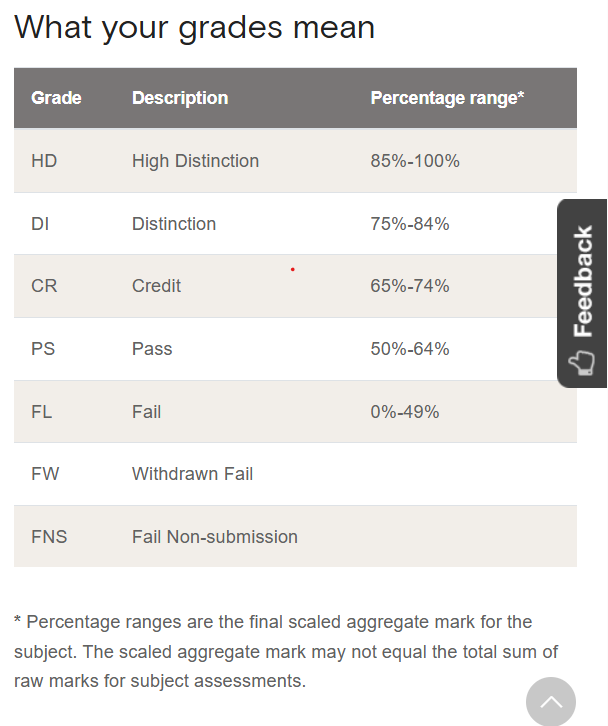
Perhaps the most analysed and possibly stress-inducing numbers at uni come under the heading of “what your grades mean” in the Charles Sturt Student Portal. There’s no grey area here. The numbers list criteria required for a High Distinction, Distinction, Credit, Pass, and Fail. Dip below these cut-offs by even half a percentage point and you’re down to the next level of grade.
Grade Point Average (GPA):
This then feeds into the Grade Point Average (GPA), which, naively, I had to Google at the start of last year when I started at Charles Sturt. I had to work out what this acronym stood for! A GPA is an average calculation of the total marks received divided by the number of subjects you’ve completed.
In my first four subjects, my GPA came to 5.25, which was a combination of a distinction, two credits and a pass.
In some ways, the focus on this number could keep me awake at night. Yet I am in a unique position with this particular course: my GPA for getting into an Honours program only uses the GPA from my bachelor’s degree in the second-and third-year full-time equivalent.
For more information on understanding your grades and GPA, please visit here: https://www.csu.edu.au/current-students/studying/assignments-and-exams/grades
Overall
Understanding these very uni-specific numbers has been an education in itself.
Numbers matter. But numbers are more of a focus for some people than others. It’s about understanding and accepting the importance of numbers within your individual study program.
Charlie blog is a SSAF initiative.